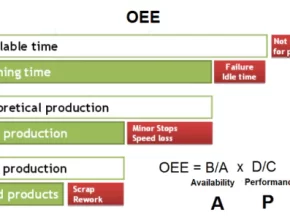
OEE, or Overall Equipment Effectiveness, is a brilliant invention that, in a single number, tells you how much waste there is on your shop floor. It is the ratio of what you produced to what you could have produced – the actual output to the theoretical possible output. It tells you how efficiently you are using your equipment and your investment. This is the OEE formula.
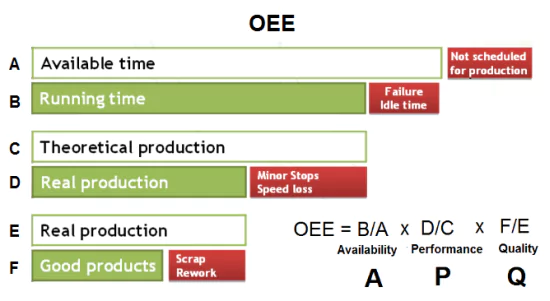
OEE = Availability x Performance x Quality
The components A, P and Q in the OEE formula can be summed up representing:
1. How much time did the machine run ?
2. How efficiently did it run while it was running ?
3. How many good parts did it produce while it was running ?
Availability: Is the machine operating or not? The ratio of the time that the machine was running, to the time that it could have actually run. The difference is because of idle time caused by breakdowns, setup, shift-change, etc.
Performance: How fast is the machine running? The ratio of the number of parts produced to the number of parts that theoretically could have been produced in the time that the machine was running. The difference could be because of inspection, insert changes, tool breakage, etc. between the start and end of a cycle. On a CNC machine, the difference could be due to using the feed rate or spindle speed override.
Quality: How many good parts were made? The ratio of the number of parts that pass quality inspection to the total number of parts made. The difference is the number of parts rejected. Calculating OEE allows you to measure and reduce waste (of available time, machine capacity, raw material) on the shop floor. It is a single number that you can communicate to, and is understood by, everybody from the machine operator to the CEO. It can be tracked month-on-month, improved upon.
What are the losses in the OEE formula ?
| Type of loss | Meaning | Examples | |
|---|---|---|---|
|
L1 |
Not scheduled for production
|
Time when the machine is not planned to run
|
Non-working shifts, holidays, lunch breaks, tea breaks
|
|
L2 |
Failure, Idle time
|
Time when the machine is planned to run, but is not running. This includes all events that stop production long enough where it makes sense to track a reason for the downtime (typically several minutes).
|
Setup, machine breakdown, inspection, accident, no raw material, power shutdown, part unloading and loading.
|
|
L3 |
Minor stops, Speed loss
|
Machine running at lower than normal production rate, and downtimes of duration so small that it does not make sense to track the reason for the downtime.
|
Part unload/load time that is longer than the standard unload/load time, cycle times that are longer than the standard cycle time, rework.
|
|
L4 |
Scrap
|
Number of rejected parts.
|
Rejection quantity
|
Availability
Availability = 100 x (Running time / Available time)
Performance
Performance = 100 x (Real production / Theoretical production)
If you are running a single part,
P = No. of parts produced / No. of parts that could have been produced
OR
P = (No. of parts produced x Std. cycle time of part) / Running time
If you are running multiple parts,
P = Σ(No. of parts produced x Std. cycle time of part) / Running time
Quality
Quality = 100 x (No. of good parts produced / Total parts produced)
OEE: A x P x Q
Example
A machine works 24 hours a day, in 3 shifts of 8 hours each.
Each shift has a break time of 30 min. (total 1.5 hrs. each day).
The standard cycle time of the part is 29 minutes. The standard part unload-load time is 1 minute. Each part therefore takes 30 minutes.
There is a downtime of 4 hours, caused by machine breakdown, waiting for raw material and power shutdown.
35 parts are made.
1 part is rejected.
Available time = 22.5 hrs. (24 – 1.5 hrs. breaks)
Running time = 18.5 hrs. (22.5 – 4 hrs downtime)
Availability = 100 x (18.5 / 22.5) = 82.2 %
Theoretical production = 37 pieces (18.5 / 0.5). Running time is 18.5 hrs, and each part takes 30 minutes.
Real production = 35
Performance = 100 x (35 / 37) = 94.6 %
Real production = 35 parts
Good parts = 34 (35 – 1 rejection)
Quality = 34 / 35 = 97.1 %
OEE = 100 x (.822 x .946 x .971) = 75.4 %.
Getting wrong numbers of OEE, Availability, Performance and Quality ? Here is an explanation on problems and fixes while calculating OEE.
Cooked up OEE formula - the harm

OEE is not something that you show others. It is something that you see yourself, to improve the capacity utilization and profitability of your machines. OEE is a number that you must constantly strive to improve, not a number that you achieve and then relax forever. This is the reason that in the OEE formula, it is important that you are truthful about losses like downtimes, rejections and rework. Manipulation in calculating OEE numbers may serve some short term aims, but are very harmful in the long term.
The most common way getting the OEE formula to give you (falsely) nice numbers is to manipulate the Availability. A lot of firms consider some common downtimes as part of the process, and NOT as downtimes. E.g., part unloading and loading, insert change, periodic inspection, setup change. This is against the logic behind calculating OEE. It artificially inflates the OEE number, and is the equivalent of hiding the dirt under the carpet.
Availability is defined as = Run time / Planned production time.
Run time = Planned production time – Downtime.
Downtime is the time when the process was supposed to be running but did not run. This includes part unloading and loading, inspection, setup changes, breakdowns, etc.
Why you must consider ALL downtimes as downtimes
You can get an artificially high Availability by excluding some down times, so the numerator in the Availability equation goes up. However, if you do this, you’ll just conclude that there no further improvement is possible, and then just sit back and relax. Example: let’s say the setup time for a part on a CNC machining center is 3 hours. If you consider this as as a part of the process instead of a downtime, you will never try to improve, and this setup time will remain constant for years together. Fixturing, tooling and machines may change and enable the setup time to be reduced, but you are not even looking at these because the high setup time does not show up in the OEE calculation. If you DO consider it as downtime, you’ll keep on trying to reduce it, by using quick change tooling, automatic tool presetter, etc. This applies to all downtimes, and can cause enormous harm to your productivity and working culture.
OEE formula manipulation - example 1
While calculating OEE, do not consider setup change times as downtime, because “How can you consider this a downtime ? After a batch of parts is completed, we have to do a setup change, right ? We must therefore consider it as a part of the cycle”. The result: Maybe you can reduce a 1 hour setup time to 20 minutes by using quick change tooling, a tool presetter, or by work and tool offset probes. You will never do this, because you have hidden this downtime waste forever and will forget that it exists.
OEE formula manipulation - example 2
In the Performance part of the OEE formula, make the whole part change time (unload-load time) a part of the cycle time, because “How can this be a downtime ? You have to unload the completed part and load a new part, right ? So it’s actually part of the cycle”. The result: Maybe you can switch to a pallet changer, or better and faster clamps on the fixture, a better and faster crane, or a robot. These will reduce the part change time, but you will never do this, because you have hidden this machine downtime and will never realize that it exists.
OEE formula manipulation - example 3
In the Availability part of the OEE formula, do not consider part inspection, periodic machine cleaning and tool change times as downtime, because you think these are a necessary part of the process. The result: Maybe you can reduce the periodic cleaning time with an automatic air blast, reduce the frequency of tool changes by using longer lasting tools. Maybe you can speed up the inspection or reduce its frequency. Since these machine downtimes are hidden forever and not highlighted in the OEE, your shop floor’s culture and system will forever ignore these downtimes because they do not exist.
As you can see, the result of cooking cooking up the OEE formula has long term consequences. There really is no point in inflating OEE numbers by hiding downtimes. Do not treat OEE as an absolute number like a pass or fail number, that needs to be achieved by hook or crook. Instead, use it as a number that shows your real productivity that needs to be improved constantly. Set a target for periodic incremental improvement, like 1 or 2 % per month. Just be truthful about all the downtimes and let them be visible, so that you will always keep looking for ways to reduce them.
This is the key principle of calculating OEE in your LEAN journey – be honest about your wastes. Do not hide them.
What is TEEP ?
TEEP definition, TEEP calculation, and OEE vs. TEEP difference.
Losses on the shop floor can be divided into Equipment losses and Schedule losses.
Equipment losses are the losses (downtime and rejections) in the time that a machine is scheduled to run. This is measured by OEE.
Schedule losses are the time that the machine was not scheduled to run, but was available to run. E.g., lunch and tea breaks, non-working shifts, holidays, no orders. This is measured as Utilization.
OEE is how effectively you have used the scheduled production time. TEEP is how effectively you have used ALL the time, which is 24 hours a day, 7 days a week.
TEEP considers both equipment losses AND schedule losses, ie. OEE AND Utilization.
TEEP calculation
Using the OEE formula itself
This is the Availability calculation in the OEE formula.
Availability = 100 x (Running time / Available time)
The Available time in OEE excludes all scheduled downtimes – like meal breaks, holidays, no planned production, preventive maintenance.
To calculate TEEP, simply use the TOTAL time including all scheduled downtimes.
Calculating OEE and then getting TEEP
Utilization = Planned production time / Total available calendar time
TEEP = OEE x Utilization.
Example 1
A machine’s OEE is 60 %. It runs 24 hours a day, without any breaks, 6 days a week.
The Utilization is 6/7, or 85.7 %.
TEEP = 100 x ((OEE/100) x (Utilization/100)) = 51.4 %
Example 2
A machine’s OEE is 60 %.
It works 12 hours a day, with lunch and tea breaks totaling 1 hour, 6 days a week.
Utilization is (11 x 6)/(24 x 7), 39.3 %
TEEP = 100 x ((OEE/100) x (Utilization/100)) = 23.6 %
Why should you be using TEEP ?
When you get a loan from a bank to buy a machine, you need to repay the bankers the principal + interest on the loan every month. The bankers do not care how many hours you run the machine. If you run the machine only 12 hours a day, your revenue is half of what it could have been if you had run it 24 hours a day. It makes sense to run the machine longer hours – run it 24 hours, across weekly off days. TEEP makes more sense than OEE as a measure of your ability to repay the bank loan.
Etc
Biryani and Pulao – what’s the difference ?
The word Biryani is derived from the Persian word ‘Birian’. In Persian, Birian means ‘Fried before Cooking’. Meat (or vegetables) is fried in ghee and half-cooked. Separately, rice is fried in Ghee and half-cooked. The rice and meat are layered in a vessel called a Handi. You can see the layers in the vessel, and the different layers are visible and have a different taste when served.


Pulao is from the Persian word Pilaf. Rice is browned in oil, and separately, meat (or veg) is fried in Ghee and cooked with aromatic spices in water. The rice and this broth are mixed together and cooked. The pulao is a homogenous mixture when cooking, and looks and tastes homogeous when served.


The difference between biryani and pulao is in the LAYERS. Biryani has layers, while pulao does not. So Biryani is multi-dimensional and more interesting as you eat it.
I first learnt this about this difference some years ago, in a restaurant in Bangalore called Biryani Merchant (no longer in existence, sadly). They served 3 different types of biryani on any given day (out of the 10-odd types in India). India has a large variety of Biryanis: Lucknow, Hyderabadi, Kashmiri, Ambur, Kolkata, Bohri, Calicut, Tahiri (this is a vegetarian biryani). There was a leaflet on each table educating you about biryani. The menu was fixed, and you paid a fixed amount, ate as much as you could.
Way back then, as a young lad of 45 I could put away vast quantities of food. Owners of ‘eat-all-you-can’ establishments used to shiver as I walked in, thinking of the damage I was about to do to their profits. Since then, I’ve been trying to eat less and eat healthy (please note, trying, not actually happening), so restaurant owners have less stress in their lives.
What is this non-technical writing doing in a technical blog ? Here’s the explanation.